Fishtank Temperature monitor

So while having an enforced break from work I figured maybe it would be fun to hook my Pi Zero up to a waterproof temperature sensor and drop the sensor into my aquarium.
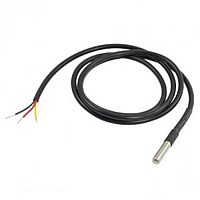
A spot of research suggested this was a common use for a Pi, with almost everybody using the 1 Wire DS18B20 sensor. A bit of googling later found this sensor on eBay, waterproof and with a nice long cable. Sorted.
A very useful blog post is here, much more detail is provided there, I used the sample python code almost verbatim for the reading of the temp, only adding a few config options and the ability to post to a MQTT broker.
I’ve pushed two versions of my code to GitHub here, one which publishes to an MQTT broker and the almost unchanged version of the code from the blog post linked above, which simply prints the temp (only in C in my version) to STDOUT. The only modification I made was to enable the specification of the 1-Wire sensor device name via the ‘W1_DEVICE’ environment variable. If you don’t provide that the code tries to figure it out, but then will only support a single sensor (I think!). If you have multiple sensors then just put the name of the device in the ‘W1_DEVICE’ variable.
Other things of note.
I had to fiddle with the config.txt settings, they seem dependant on kernel version. For reference, on my Pi Zero I’m running this version:
Linux zero 4.1.13+ #826 PREEMPT Fri Nov 13 20:13:22 GMT 2015 armv6l GNU/Linux
My working config.txt settings:
dtoverlay=w1-gpio,gpiopin=4,pullup=on
I also created the file “/etc/modules-load.d/one-wire.conf" containing just these two lines:
w1-gpio
w1_therm
This forces the module loader to load the 1 Wire GPIO module and the 1 Wire Thermometer sensor.
If you have troubles with my python code, the following bash, pasted into a terminal should work ok.
Finally
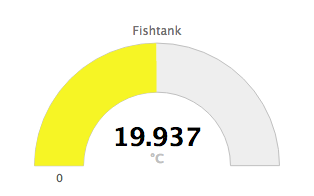
Now I had the temperature being published to my MQTT broker (Mosquitto), it was a simple matter to pull that off the bus using the Paho JavaScript MQTT client, and render out a little gauge using the excellent Highcharts JS charting library. A snapshot of the gauge can be seen up at the top of this blog post, info.riviera.org.uk - which is where I keep a bunch of my ‘data’ collection things.
Subscribe via RSS